
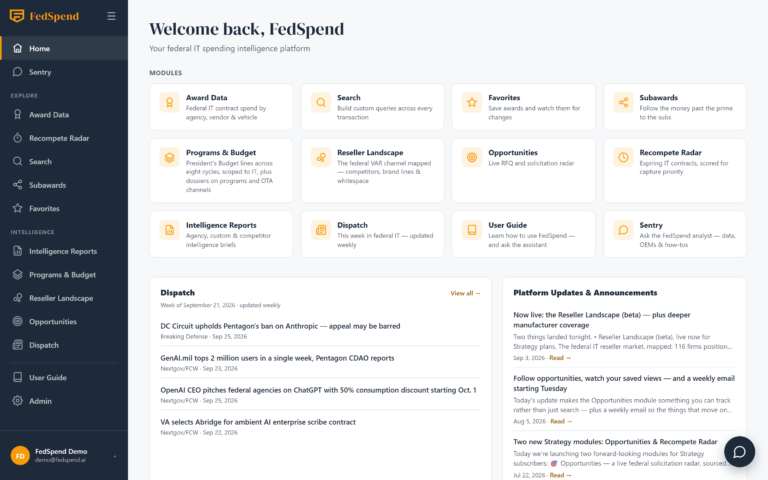
Federal IT Intelligence Platform
Who buys what I sell? Who’s really under the prime? What’s expiring in my accounts — and when?
Every question a federal capture team asks, answered with queried numbers — from $675B+ in IT obligations, the budget behind them, and the solicitations ahead of them. Never a guess.
Who buys what I sell — and through whom?
Answered by Award Data
Pick a fiscal year and see every agency, vendor, and vehicle. Drill into the Navy, open Leidos, land on the award — four clicks from $675B to one transaction.
2.4M transactions · 74 agencies · monthly refresh
Explore Award Data →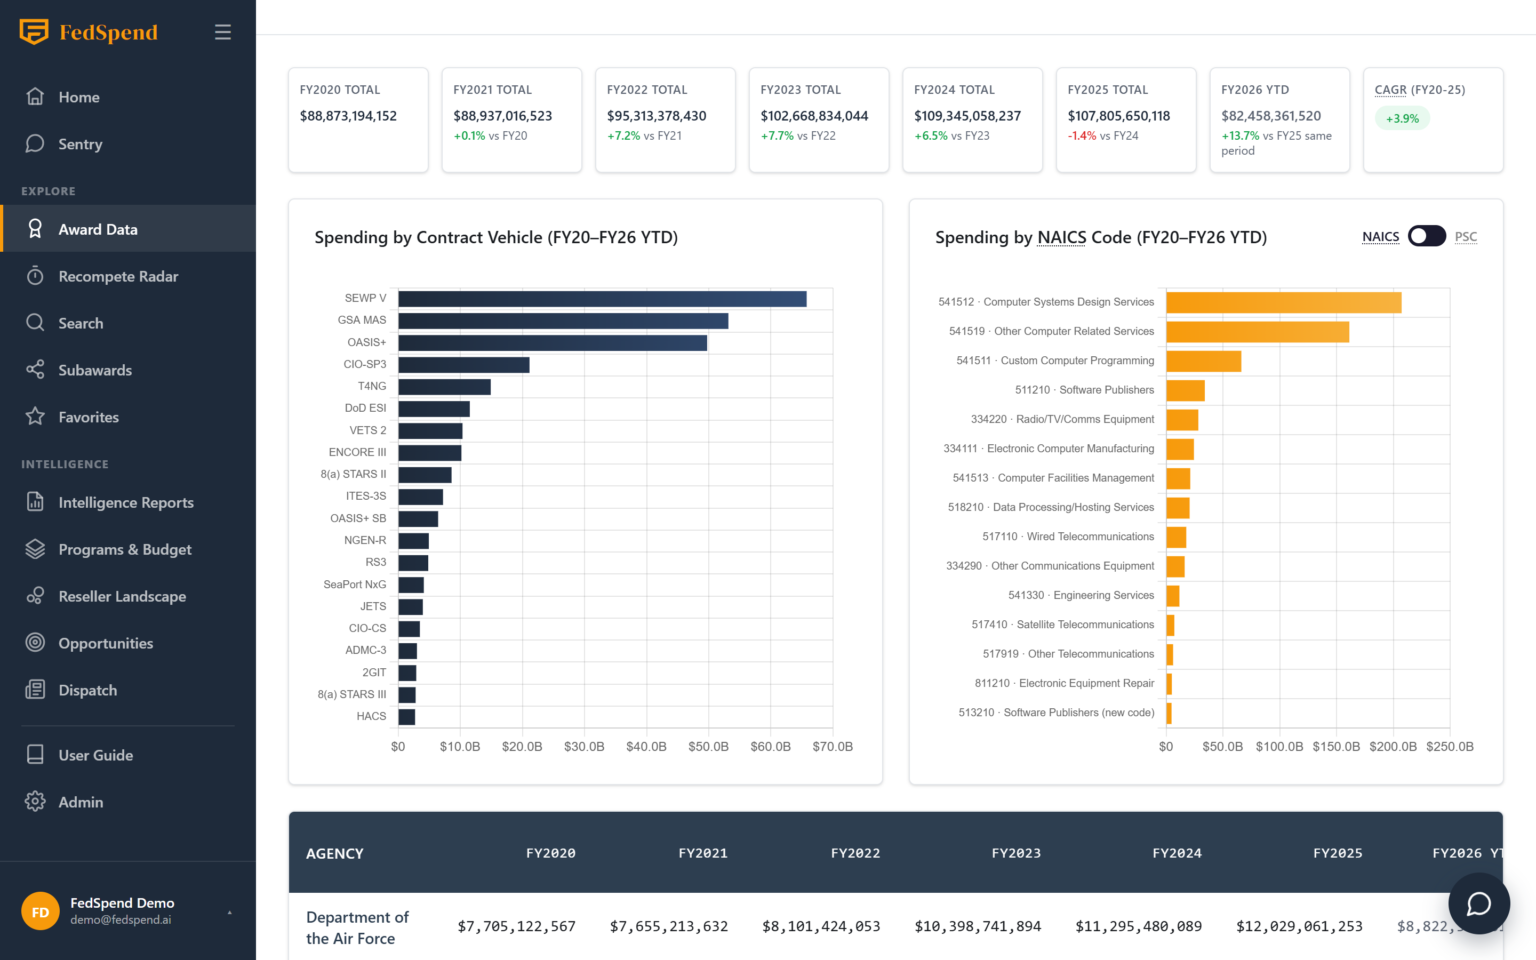
Who’s really doing the work under the prime?
Answered by Search & Subawards
One search, two tabs. The Subawards tab surfaces the IT work riding under non-IT primes — deals that never appear in a normal award search.
113K subaward records · $200B+ followed past the prime
See Search & Subawards →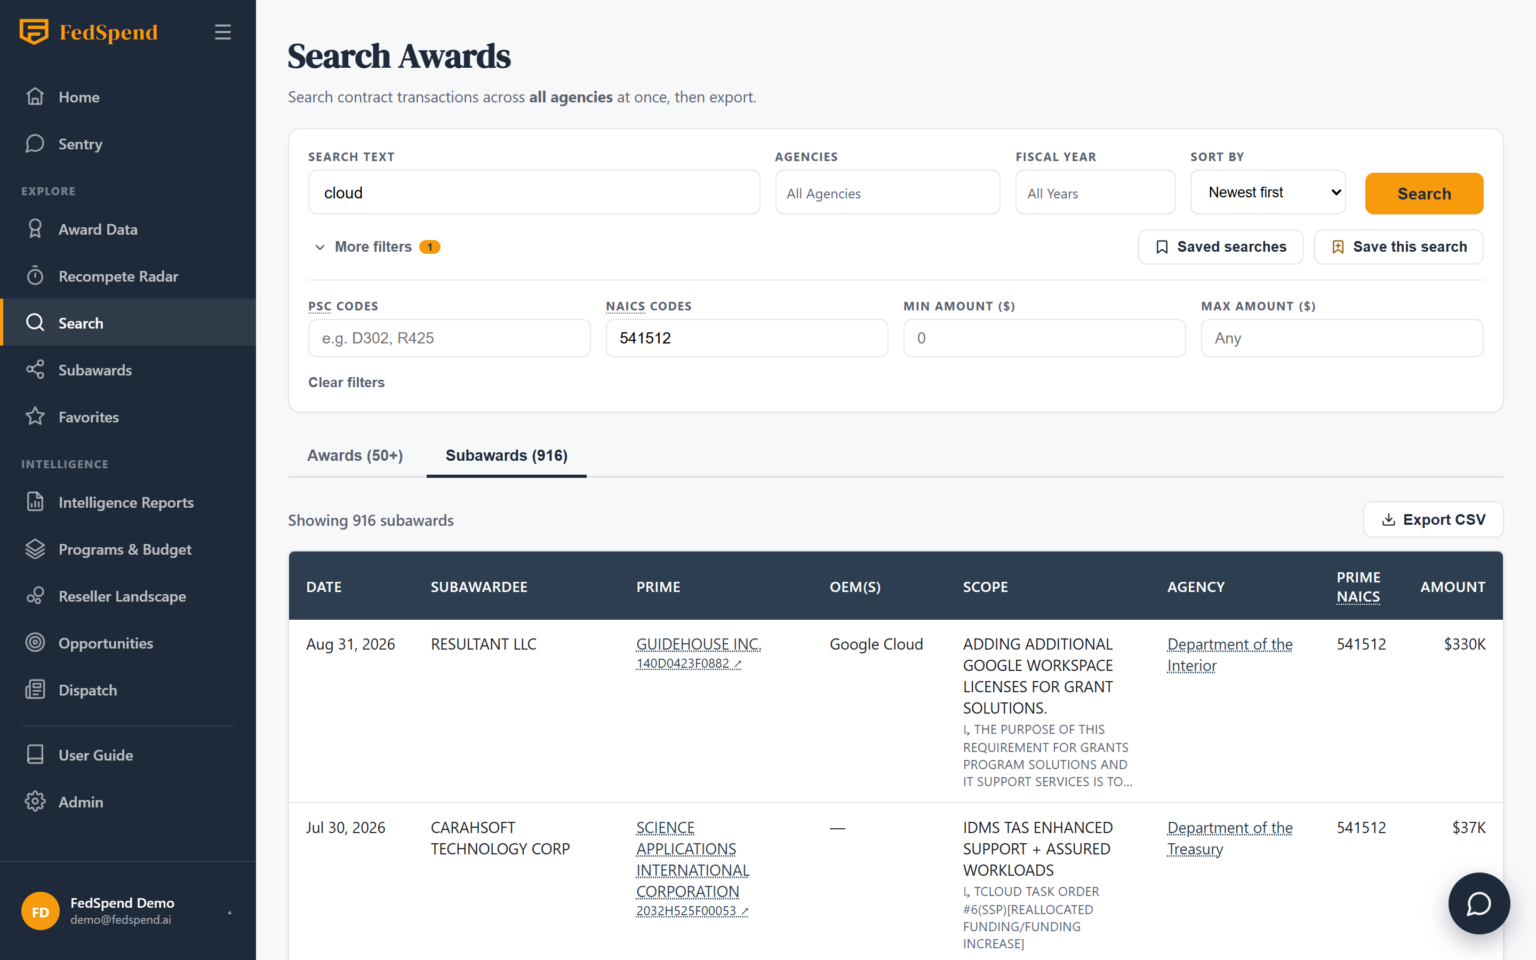
Where’s the money going next year?
Answered by Programs & Budget
The President’s Budget at line level, FY2020–FY2027 — who performs the work, why funding moved, and the RFPs the budget itself forecasts. See the program before it’s a contract.
109,448 budget lines · 20K+ named performers · 34 OTA consortia
Explore Programs & Budget →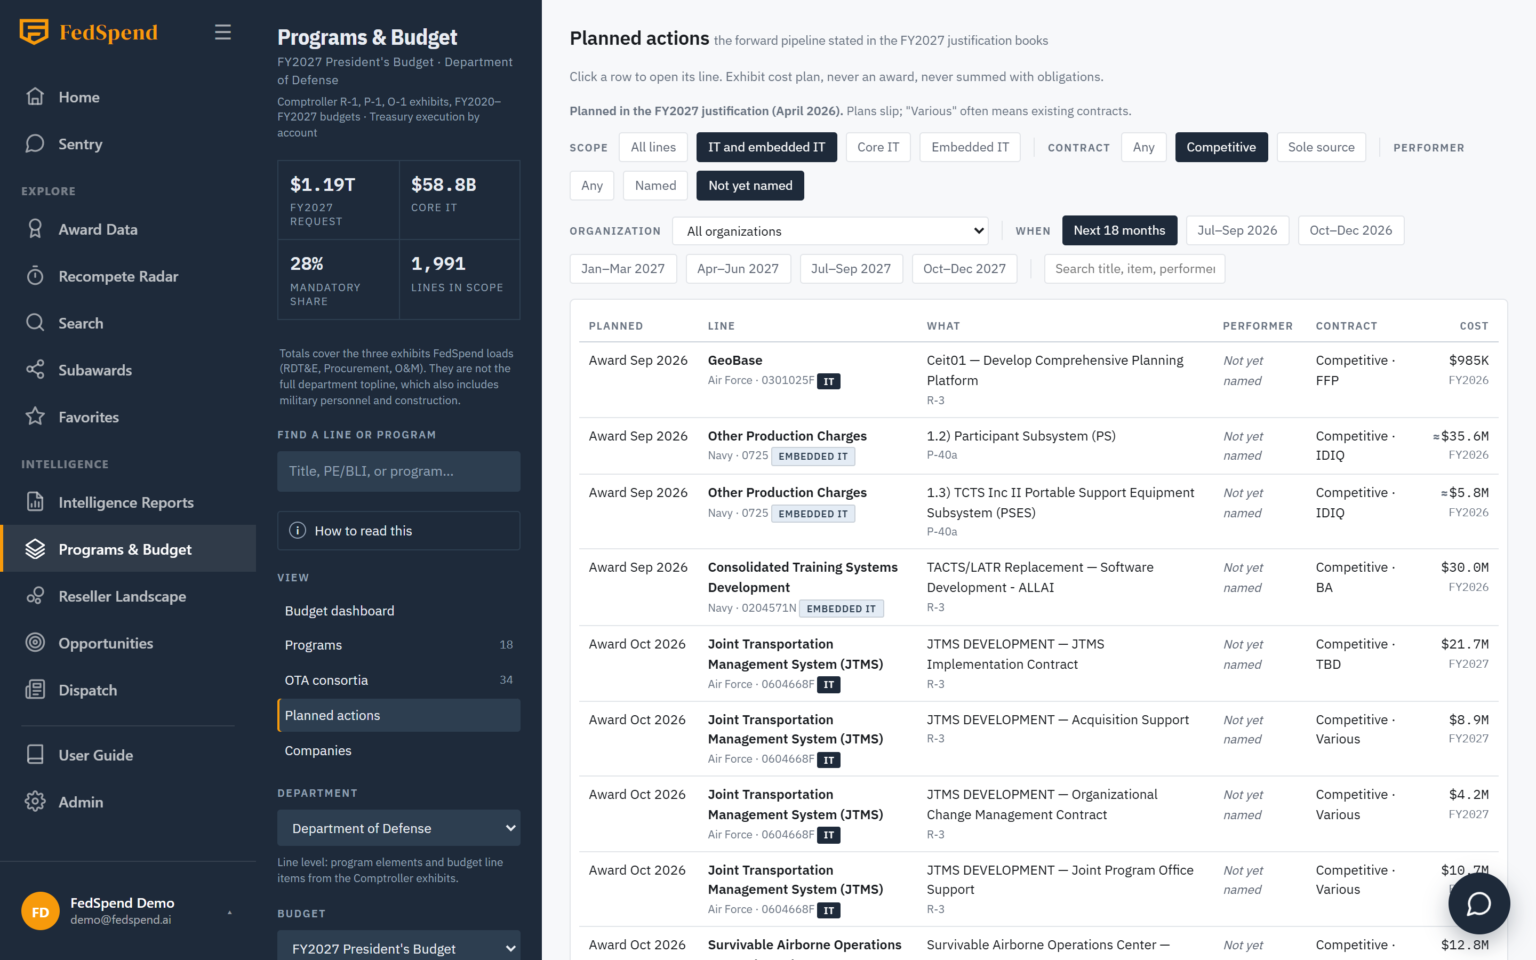
What’s expiring in my accounts — and what just posted?
Answered by Recompete Radar + Opportunities
Nearly 100,000 active IT contracts scored 0–100 for capture priority, months ahead — and a live SAM.gov feed with saved-view alerts for the moment one becomes a solicitation.
30/90/180-day windows · task orders & IDV shells split out
See the capture pipeline →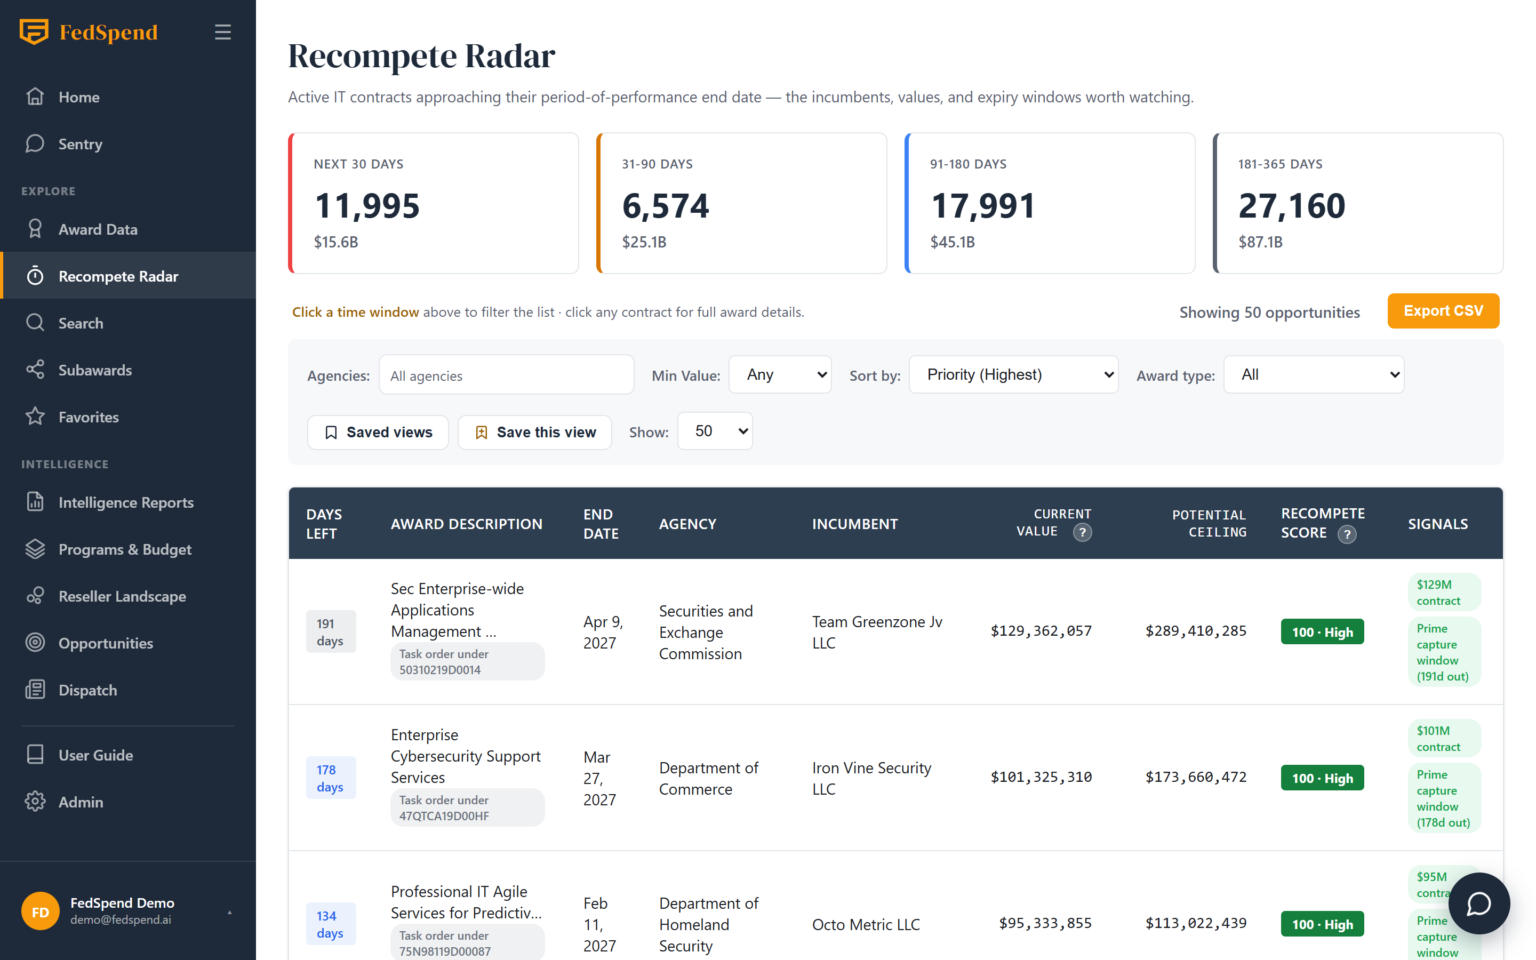
Who are my channel competitors — and where are they weak?
Answered by Reseller Landscape
The federal VAR market on one map: ~115 firms by defense share and product mix. Open any firm for its six closest competitors and the line-card gaps between you.
$63B+ mapped · ~160 brand pages · 13 practice areas
Open the Reseller Landscape →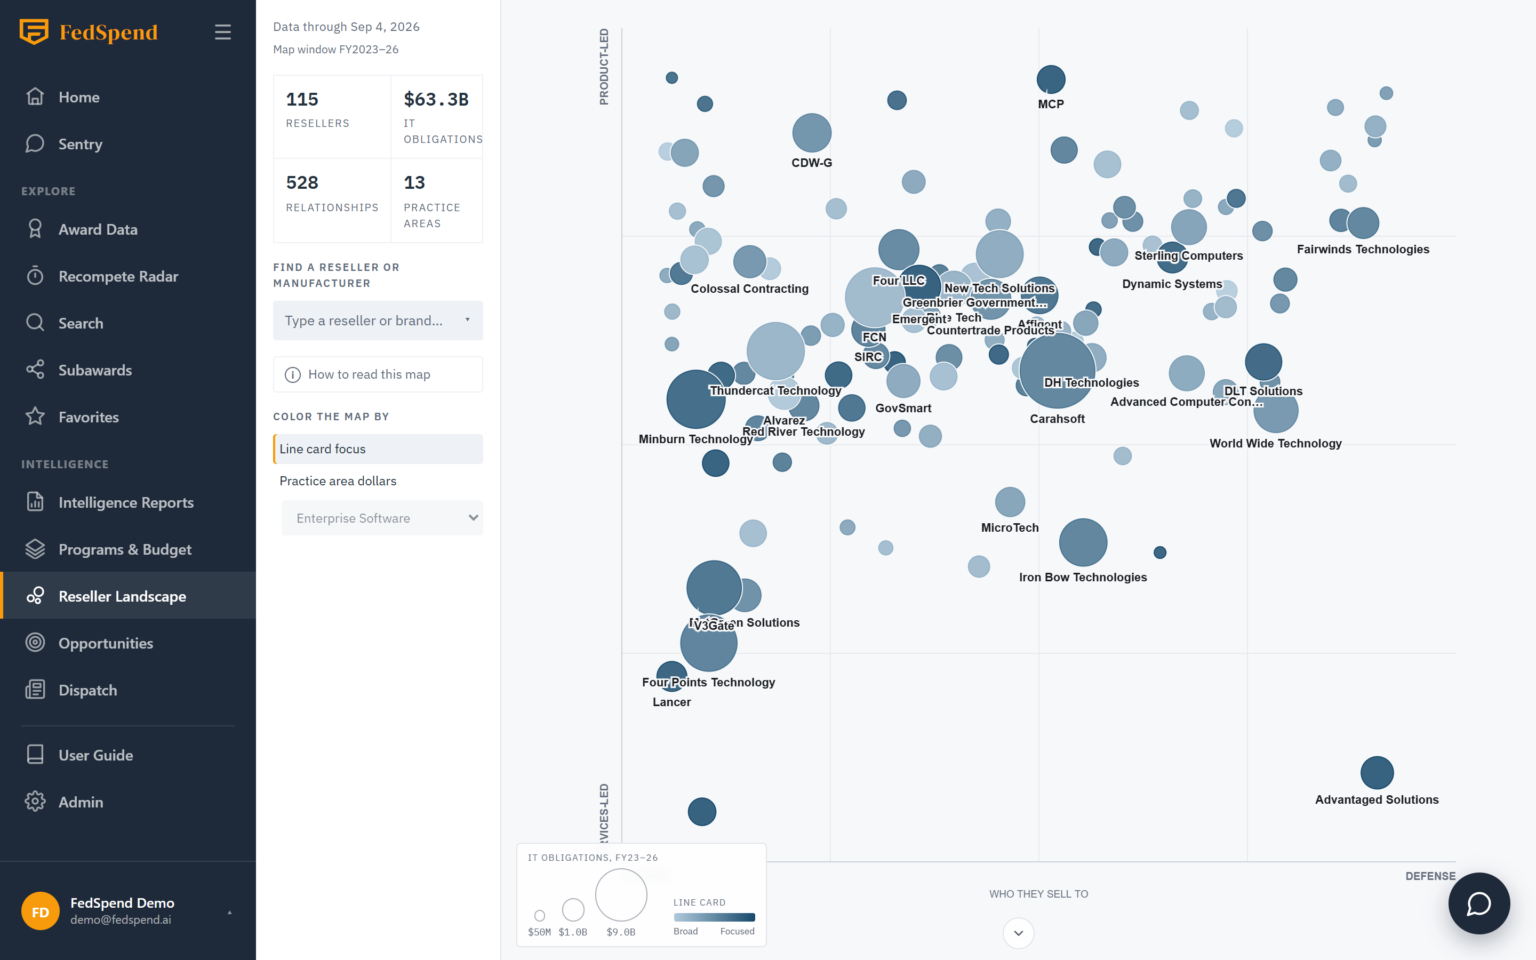
Can’t I just ask?
Answered by Sentry AI
Yes. “Who builds the Virginia-class submarine, and what’s planned for FY2027?” Sentry runs a real query and shows you the table behind its answer — then deep-links you into the data.
Live-queried numbers · never a guess · honest about limits
Meet Sentry →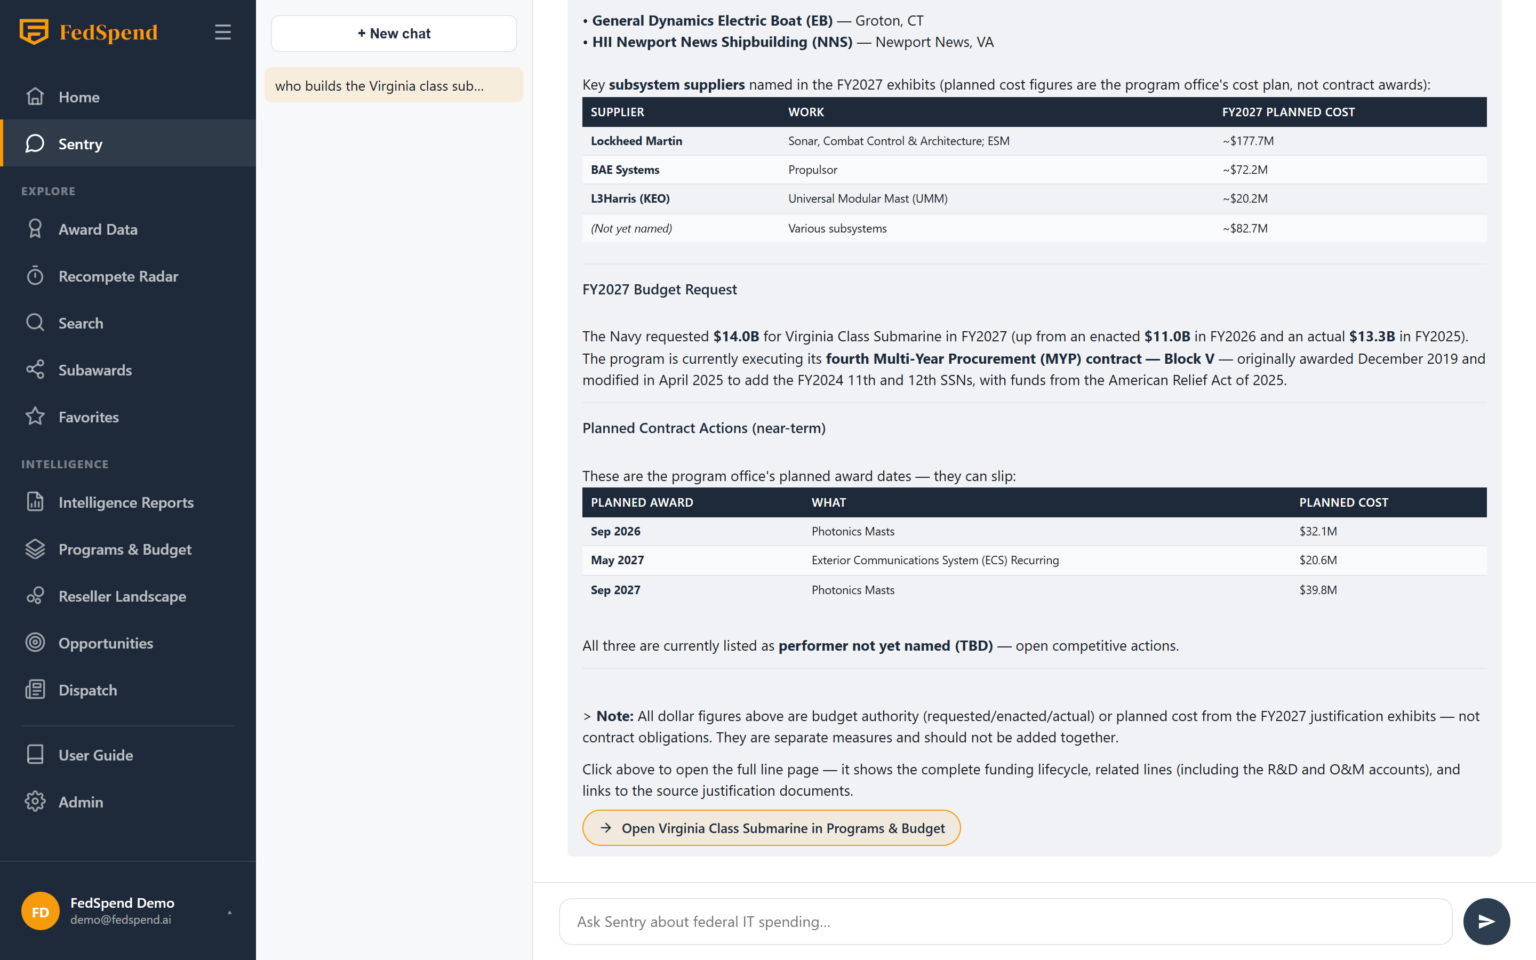
And when the answer needs to be a deliverable
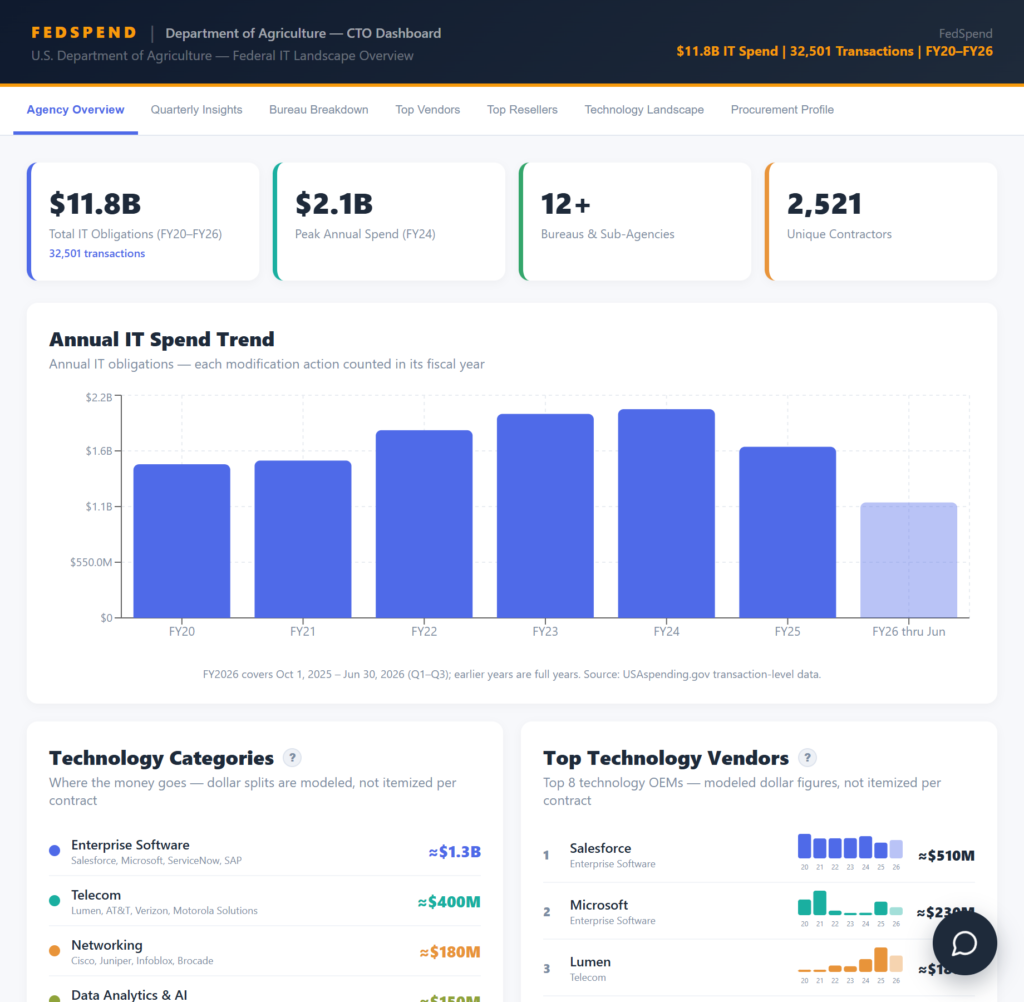
Four report families, analyst-built.
Agency Quarterly · Every Plan
Every agency, every quarter, automatically — six tabs from overview to top vendors, shareable with a public link.
OEM / GTM Briefs · Strategy
Commissioned vendor × agency competitive briefs and market-entry playbooks, assigned privately to your account.
VAR Competitive · Strategy
The reseller’s own brief: your footprint vs. the field, built on the Reseller Landscape.
$675B+
IT Spend Analyzed
2.4M
Transactions
109K
Budget Lines
~100K
Recompetes Scored
The next question your VP asks,
you’ll answer from memory.
14-day free trial on both individual plans. From $79/mo.